2025 Charging Infrastructure Full Year Review
It's January 2026, time to see how charging infrastructure's developed over the course of 2025.
It's July 1 2026, time to see how charging infrastructure's developed over the first half of 2026.
Overview
First up, the overall change in the number of live connectors from January 1 to June 30. We source our data on non-domestic charging infrastructure from Open Charge Map, & we've an interactive Infrastructure Data dashboard available based on it.
| Connector | January 1 | June 30 | Numeric Change | % Change |
| CCS | 1,487 | 1,751 | 264 | 18% |
| Chademo | 454 | 448 | (6) | (-1%) |
| Type 2 | 5,897 | 6,223 | 326 | 6% |
Next, let's look to what charging infrastructure is still on the way. We are currently tracking 515 locations on Infrastructure Updates (Member Version), & their statuses are as follows:
| Status | Number of Locations |
| Now Building | 60 [amounting to 300+ connectors] |
| Announced | 299 |
| Decision Pending | 36 |
| Further Info Required | 17 |
| Approved | 100 |
| Refused | 2 |
| Appealed | 1 |
County Level
Presented below are the total counts for each of the various live connectors per county.
| CCS |
 |
| Chademo |
 |
| Type 2 |
 |
Spotlight on CCS
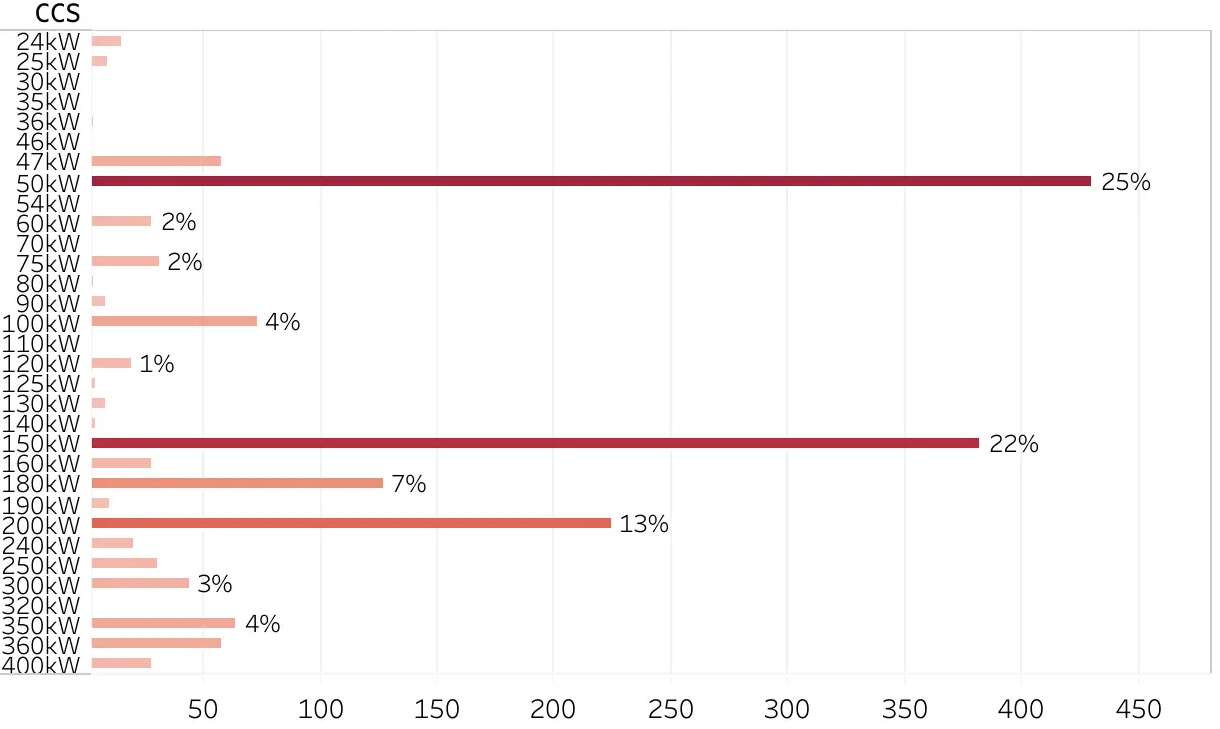
We'll focus on CCS as it's the dominant fast / high power connector. First up, what charging speeds are associated with those 1,751 CCS connectors?
| CCS connectors by Charging Speed (kW) |
|
|
We note that advertised charging speeds typically reflects a unit's single vehicle potential.
Now let's take a look at the change in CCS from the perspective of charge point operators (or services), again sorted from the highest to lowest change in numbers.
| Operator | January 1 | June 30 | Numeric Change | % Change |
| ePower | 127 | 202 | 75 | 59% |
| EZO | 316 | 384 | 68 | 22% |
| ESB ecars | 361 | 394 | 33 | 9% |
| Applegreen Electric | 98 | 122 | 24 | 24% |
| Circle K | 80 | 98 | 18 | 23% |
| Business Owner | 285 | 300 | 15 | 5% |
| Weev | 25 | 35 | 10 | 40% |
| Source | 8 | 18 | 10 | 125% |
| InstaVolt | 17 | 25 | 8 | 47% |
| Lidl | 6 | 6 | 100% | |
| Monta | 32 | 29 | (3) | (9%) |
| Tesla | 60 | 60 | ||
| Ionity | 48 | 48 | ||
| Brite | 14 | 14 | ||
| Maxol | 6 | 6 | ||
| Certa | 2 | 2 | ||
| Stop N Top | 2 | 2 | ||
| ChargePoint | 2 | 2 | ||
| Fuuse | 2 | 2 | ||
| eStation | 1 | 1 | ||
| GOcharge | 1 | 1 |
Accounting for around four fifths of the new CCS so far this year were: EZO, ePower, ESB ecars, Circle K, & Applegreen Electric.
Summary
With an increase of 448 CCS connectors in 2025, 2026 looks set to surpass that with three fifths that amount, 264, already now live in H1 2026 & a significant number already in the ground & awaiting power.
We note too the slight, 1%, decline in Chademo connectors, which relates primarily to unit replacements (a CCS plus Chademo unit being replaced with a dual CCS unit) exceeding the rate of new units with them.
It's January 2026, time to see how charging infrastructure's developed over the course of 2025.
It's July 1, time to see how charging infrastructure's developed over the first half of the year!
The Irish government’s Department of Transport has opened the public consultation phase for their...